Today, as you already know, managing personal expenses has become more important than ever. And honestly, there are so many apps out there that claim to make it easy. You can download one in seconds and start recording your spending right away. But the problem is, most of us don’t actually stick with those apps for long. Sometimes they feel too complicated, sometimes they don’t match how we spend money in real life, and sometimes we just forget to use them. On top of that, not everyone is comfortable storing their financial data inside an app.
That’s where Excel becomes a really practical option. It’s simple, flexible, and completely under your control. You don’t have to follow someone else’s system — you can build your own in a way that actually fits your daily life. And more importantly, Excel doesn’t just help you record expenses… it helps you understand them.
Before tracking… let’s be honest for a second
Most people don’t really know their expenses. We usually think:
“I didn’t spend that much this month”
👉 Food is higher than expected
👉 Some expenses are completely unnecessary
👉 Subscriptions and hidden charges go unnoticed
👉 Small daily spending adds up
👉 Cash spending feels small but becomes a big amount
👉 Cash spending feels small but becomes a big amount
Before we start analyzing anything, we first need a place to properly record all our expenses.
In this step, we are creating a simple Excel sheet where you can enter your daily spending. This will be the base of everything – because without proper data, you can’t understand or analyze your expenses.
Don’t try to make it complicated. Just keep it simple and practical.
At this point, instead of building everything from scratch, you can use the Excel file I’ve shared. But before you start using it, take a moment to understand how it actually works. This is important, because once you understand the structure, everything else becomes very easy.
The file is designed in a simple way, but it’s still powerful. It contains three sheets, and each one has a clear purpose
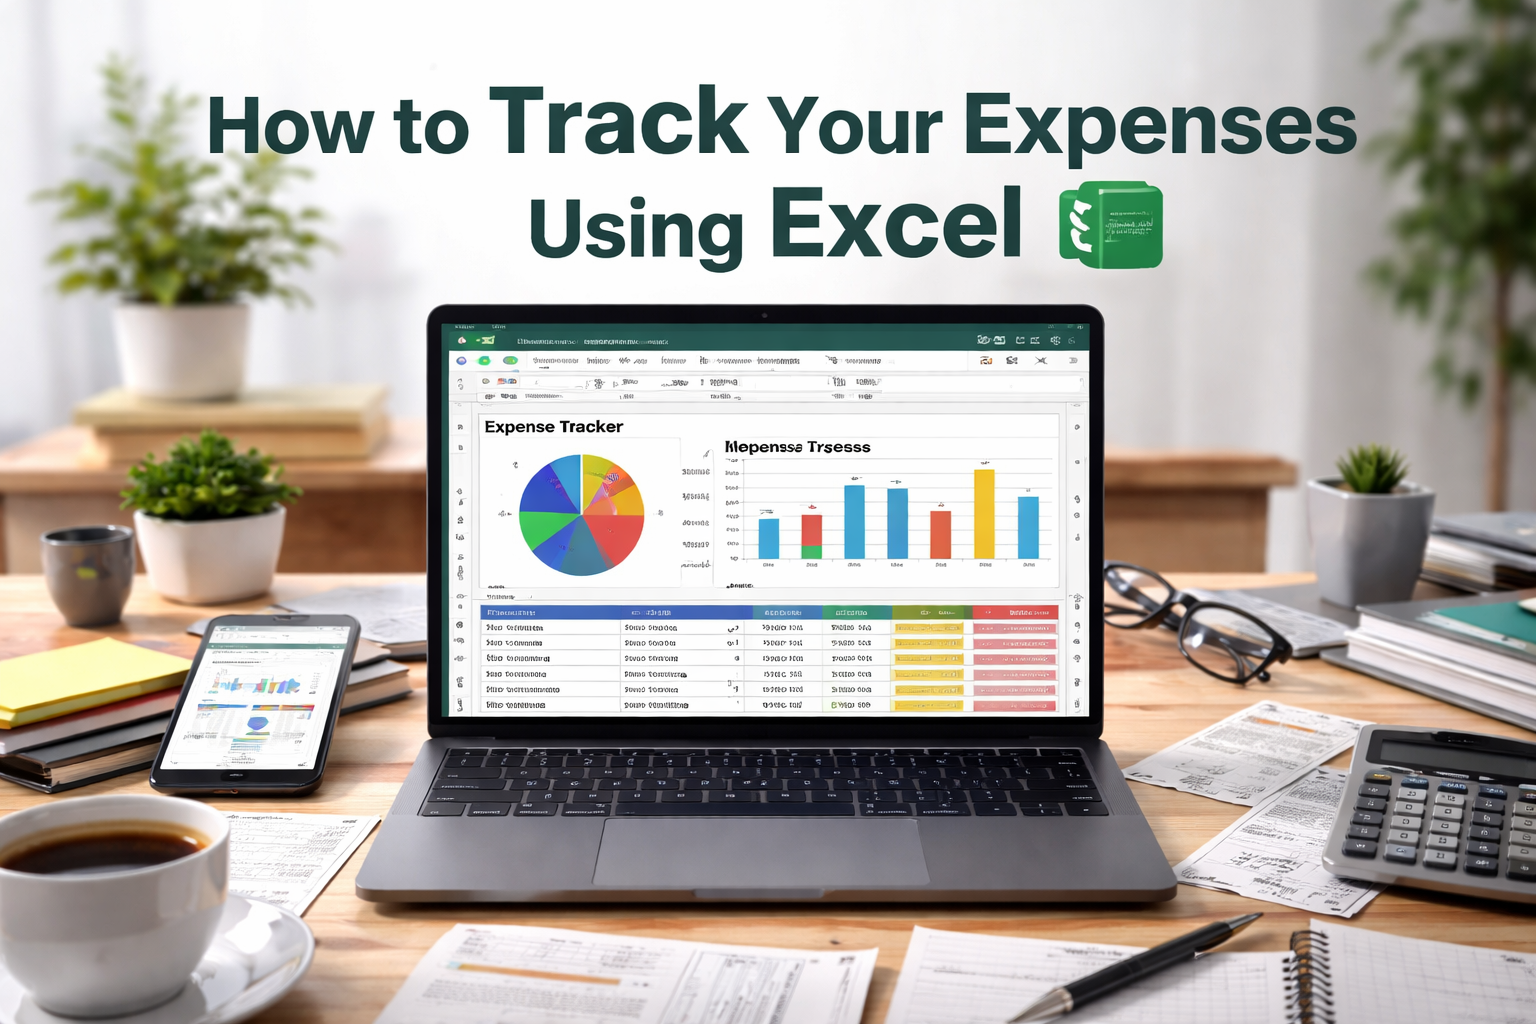
1. Dashboard (Your Quick Overview)
This is the main page.
👉 Here you can quickly see:
✅Your past month expenses
✅Your current month expenses
✅The variation (increase or decrease)
✅A simple chart visualization
You don’t need to enter anything here.
👉 Everything updates automatically based on your data.
2. Expense Data Sheet – Last Month
This sheet contains your previous month data.
👉 It is used only for comparison.
You don’t need to change this daily.
3. Expense Data Sheet – Current Month
This is the most important sheet.
👉 This is where you enter your daily expenses.
Date|Category|Amount|Notes
Now there is one important habit you need to follow. At the end of the month, once you finish entering all your expenses, you need to copy all the data from the current month sheet and paste it into the last month sheet. After that, clear the current month sheet and start fresh for the new month. This small step is what keeps your dashboard accurate. If you skip it, your comparisons will not make sense.
Once you follow this cycle for a couple of months, you’ll start seeing something interesting. You’re no longer just recording expenses-you’re building a system that shows how your spending changes over time.
Now this is where things really start to make sense. Up to this point, you’ve been entering your expenses and letting Excel organize everything for you. But the real value is not in the data — it’s in how you understand it.
When you open your dashboard, you’ll start seeing variations between your past month and current month. Some categories will go up ⬆️, some will go down ⬇️, and some will stay the same ➡️. At first glance, it may just look like numbers, but if you take a moment to think about it, it actually tells you a lot about your spending habits.
🔍 What Do These Variations Mean?
Let’s break it down in a simple way.
🍔 Food (78 → 108 | +30 ⬆️)
Your food expense has increased from 78 to 108, which is a +30 increase. This usually means you’ve been spending more on eating out or buying more groceries than last month.
From a cash perspective, this is something you need to watch carefully. Food is necessary, but it’s also one of the easiest areas where unnecessary spending happens without you realizing it. Small daily purchases slowly turn into a big monthly amount.
👉 Action: Try to reduce eating out and plan your meals better. Even small changes here can save a noticeable amount.
🎬 Entertainment (7 → 0 | -7 ⬇️)
Entertainment has dropped from 7 to 0, which means you reduced spending in this area.
This is a positive impact on your cash flow because it shows that you are cutting down on non-essential expenses. Even small reductions like this help improve your overall financial control.
👉 Action: Maintain this balance. You don’t need to completely stop, but avoid unnecessary spending.
🏠 Housing (500 → 500 | 0 ➡️)
Housing expenses stayed the same at 500. This is expected because rent and utilities are usually fixed.
From a cash perspective, this is a stable expense. There’s not much you can change here on a monthly basis.
👉 Action: No immediate action needed. Just make sure it stays consistent.